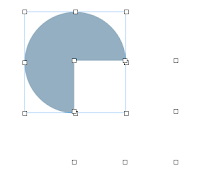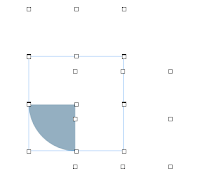
 I was asked recently if it was possible to draw segments in Pages. The Shapes menu has all the basic geometrical shapes, but not half-circles, quarter circles etc. They can be useful for simple blueprints or schemes, or just a design effect.
 It’s very easy to do it in two or three steps.
Insert a shape called ‘Oval’ (in fact it is a circle). In Graphic Inspector set it to have no Stroke (outline), choose colour.
Next insert a rectangle, remove stroke and choose white for colour. By default they would have the same dimensions, but just in case check that they do in Metrics Inspector.
Then move the white rectangle until the blue guideline ‘snap’ it to the edge of the cirlce. That way you get a 3/4 full circle with a 1/4 cut out.
 Now, if you need a 1/4 segment, insert another restangle, make it white, remove Stroke and move it over the circle until it snaps to align with the centre of the circle. Presto, you have a quarter segment.
 The grey colour I used in these examples is from the Financial Newsletter template (CMYK breakdown: 41, 19, 9, 0.
If you need to change the size of the segments, select all shapes, group them (Arrange>Group), in Metrics Inspector check ‘Constrain proportions’ and then drag handles to resize.
These are simple shapes, good to give an approximate idea of how things should look (for example to show where doors open, or the field of vision. For a more exact scaling use pie-charts in Pages or in Numbers, which have a number of attractive visual options, including 3D views.


No comments:
Post a Comment